SDGLabs Simulation Models
The SDGLabs have been developed with the methodology of System Dynamics. System Dynamics is a computer-based methodology that is used for understanding the behavior of systems over time.
Several of the models are qualitative in nature and represent a system only as a map of the most important variables and their relationships, called Causal Loop Diagrams (CLDs).
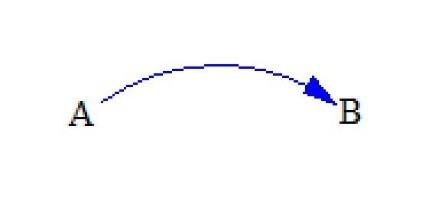
A Causal Loop Diagram is a combination of causal links between elements of the system under study; it can be seen as a mapping diagram that visualises how the elements of the system interact with each other and how the behaviour of one elements affects the behavior of another. A CLD consists of variables (systemic elements) and arrows/edges (causal relations) that connect the various variables. For example, in the figure below, variable A affects variable B.
The arrow/Edge that connects two variables does not only provide information about which variables affect other variables, but also what kind of impact this causal relationship represents. In typical System Dynamics notation, a causal link can be of two types:
- Positive. It is marked as + and it means that the two variables change in the same direction. For example, if variable A increases then variable B also increases. Or if variable A decreases then variable B also decreases.
- Negative. It is marked as – and it means that the two variables change in opposite directions. For example, if variable A increases then variable B decreases. Or if variable A decreases then variable B increases
One of the most important aspects of System Dynamics are feedback loops. Feedback loops are closed cycles of interconnected variables.
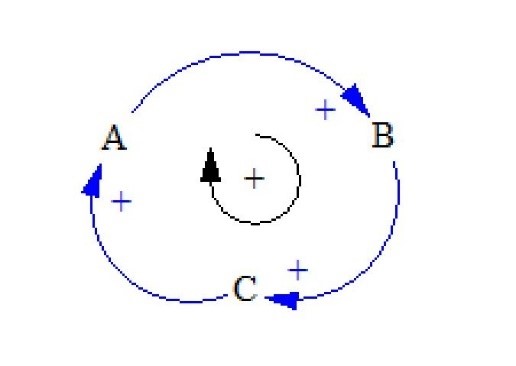
Similar to causal links, feedback loops can be of two kinds: (a) positive and (b) negative. The feedback loop of the figure above is an example of a positive feedback loop.
Positive /Reinforcing Feedback Loops: Assume the positive feedback loop of the Figure. If variable A increases, then variable B will also increase (positive causal link). The increase of variable B will cause an increase in variable C (positive causal link between B and C). The increase of variable C however will cause an increase in the variable A (positive link between C and A), which will enhance the initial increase of A.
Negative feedback loop
A negative/balancing feedback loop is form when all links are negative.
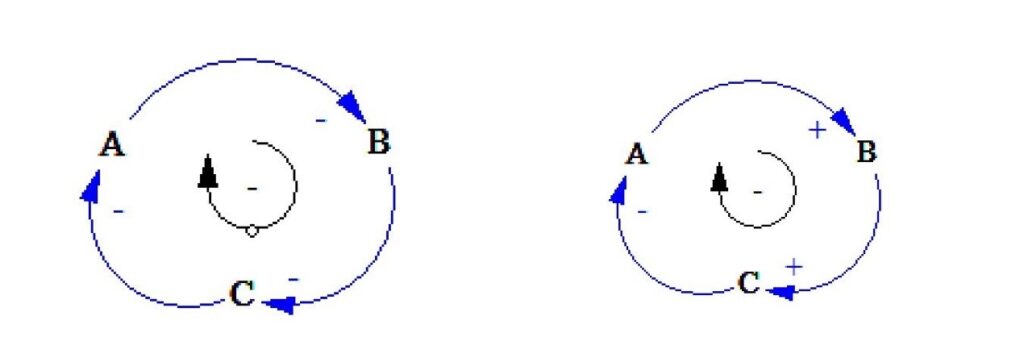
For example, the loop on the left has the following behavior: an initial increase in variable A will cause a decrease in variable B (negative causal link, opposite directions of change between the two variables). The decrease of B will cause an increase in variable C (negative causal link, opposite directions of change between the two variables), which will cause a decrease in variable A (negative causal link, opposite directions of change between the two variables). The final decrease of variable A might be bigger than the initial increase, thus canceling its original, intended effect.
Consequently, a negative feedback loop brings the system to an equilibrium and for that reason they are also called Balancing loops.
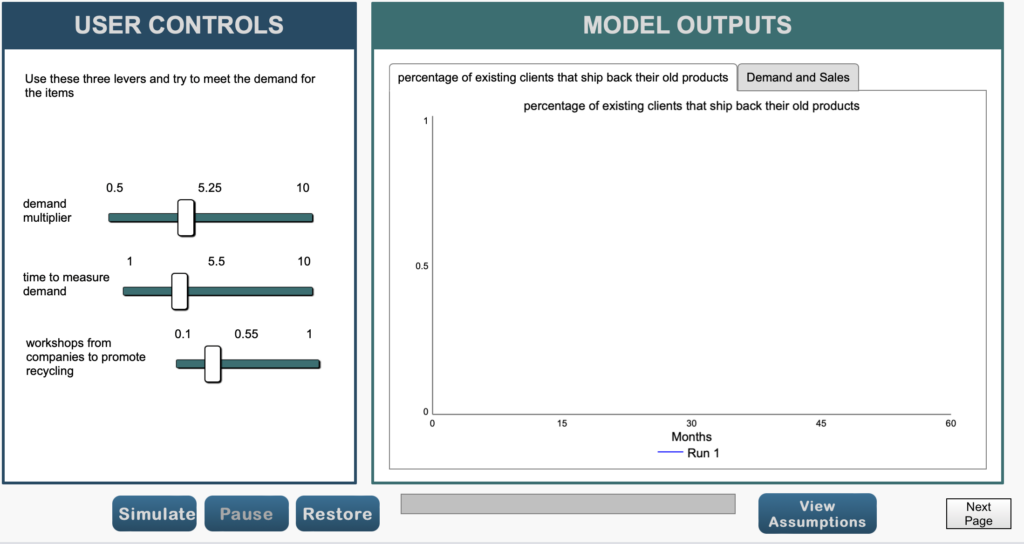
Apart from these qualitative models, the SDGLabs Model Galllery consists primarily of quantitative models. Each model has an interface in the form of a presentation. Each interface has a general description of the model, and then you are guided to the simulation page, where you can run different scenarios by changing for example the various policy sliders that are available.